
Newsletter – April 2025

The Share Market
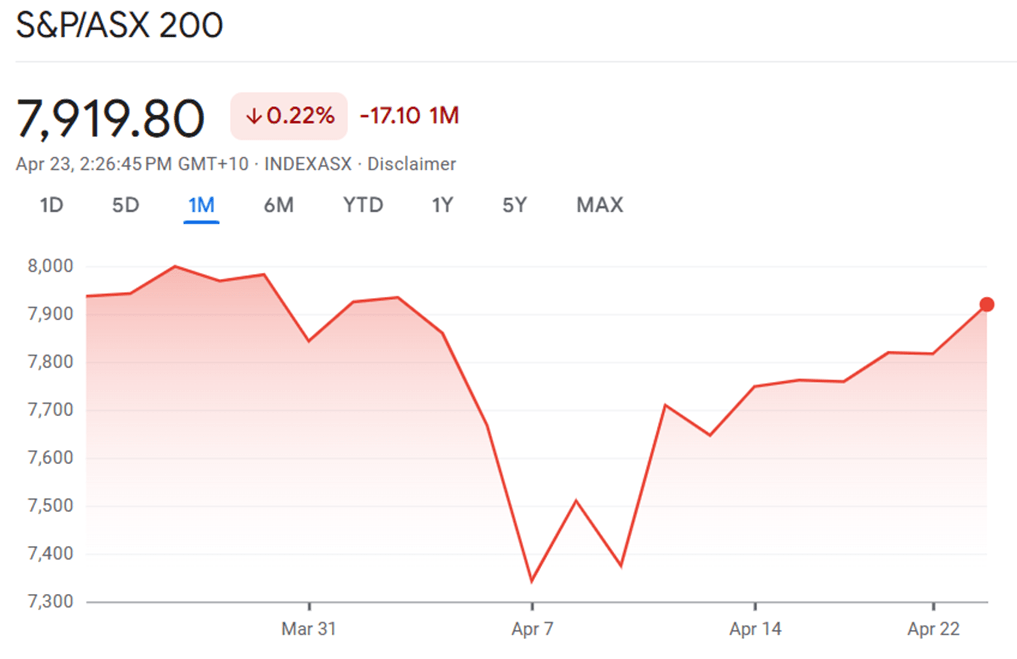
The global equity markets have experienced significant volatility throughout April 2025, with divergent performances between the Australian S&P/ASX 200 and the US S&P 500 indices. This analysis examines the movements of both indices during this tumultuous period, exploring the factors driving market sentiment and the implications for investors in both regions.
Source: Google Finance
The S&P/ASX 200 has demonstrated remarkable resilience in April despite global market turbulence. As shown in the attached chart, Australia's benchmark index currently sits at 7,919.80 points, down just 0.22% for the session on April 23. The index has charted a V-shaped recovery following a sharp decline in early April.
The April Plunge and Recovery
The ASX 200 experienced a steep decline in the first week of April, with the index falling from around 7,900 points to a monthly low of approximately 7,330 points. This represented a drop of over 7% in a matter of days. The collapse mirrored similar movements in global markets, particularly US indices, as investors responded to international headwinds.
Following this sharp correction, the Australian market began a steady recovery. By mid-April, the index had regained much of its lost ground, climbing back above 7,700 points. This recovery gathered momentum in the latter part of the month, with the ASX 200 surging 1.7% on April 23 to reach a three-week high above 7,900 points.
Sector Performance and Economic Indicators
The recovery in the ASX 200 has been broad-based but led by particular sectors. Mining and energy stocks have been standout performers, with major companies like BHP Group, Fortescue, and Woodside Energy all posting gains of 2.6% on April 23 alone. This strength reflects higher commodity prices that have helped buffer the Australian market against some of the negative factors affecting global equities.
Positive economic data has also supported the index, with Australia's private sector showing expansion for seven consecutive months through April. This expansion has been driven by gains in both manufacturing and services output, suggesting underlying economic resilience3. The strength in domestic economic activity has provided investors with confidence in the face of international uncertainties.
Market Outlook and Analyst Projections
Despite the recent recovery, the ASX 200 remains down approximately 3.50% since the beginning of 2025, pointing to the challenges that have characterised the year thus far. Investment bank Morgan Stanley has recently revised its outlook for the Australian market, reducing its year-end target for the ASX 200 from 8,500 to 8,000 points.
This adjustment suggests limited upside potential for the remainder of the year, with Morgan Stanley equity strategist Chris Nicol noting that while "Australia had levers to weather the storm in a relative sense, meaningful upside seems capped". The bank expects investors to adjust the earnings multiple that the broader market trades at, with the ASX 200's price-to-earnings ratio projected to decrease from 17 to 16.2.
Source: Google Finance
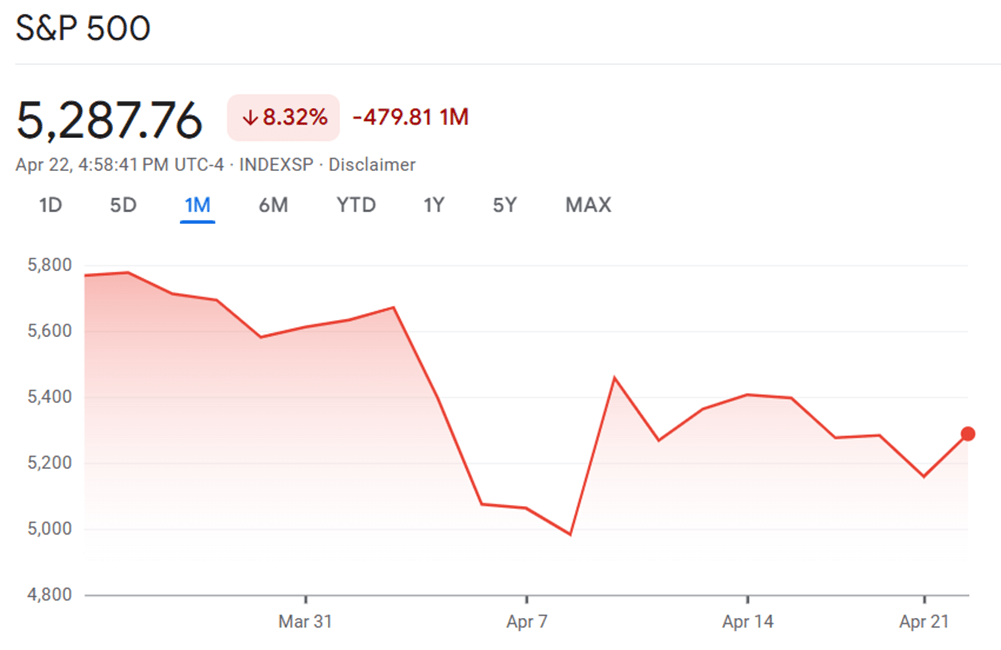
In stark contrast to the relative stability of the ASX 200, the S&P 500 has experienced extreme volatility throughout April. The attached chart shows the index currently at 5,287.76 points, having suffered a dramatic 8.32% decline over the month.
April's Rollercoaster Ride
The S&P 500 began April trading at around 5,800 points before experiencing a precipitous decline to approximately 4,970 points by April 7—a stunning drop of more than 14% from its peak. This represented the most significant correction in the index since its all-time high of about 6,100 points in February 2025.
While the index staged a partial recovery in mid-April, climbing back above 5,400 points, it has since experienced further fluctuations. The most recent data shows the S&P 500 at 5,287.76 points, reflecting a meaningful rebound of 2.51% in the April 22 session, but still significantly below its early-April levels.
Political and Economic Factors
The extraordinary volatility in the S&P 500 has been driven by several factors, most notably political uncertainty and trade tensions. President Trump's public discussion about potentially firing Federal Reserve Chair Jerome Powell created significant market anxiety, undermining investor confidence in US assets and the independence of the Federal Reserve.
Treasury Secretary Scott Bessent's description of the current tariff standoff as "unsustainable" provided some relief to markets, as did President Trump's subsequent statement that he has no plans to remove Powell from his position. These developments helped fuel the rebound seen on April 22.
The International Monetary Fund has responded to these uncertainties by cutting its US economic growth forecast to 1.8% for 2025, specifically citing the effects of tariffs that have reached a century-high level. This downward revision has contributed to investor caution.
Corporate Earnings Impact
The earnings season for the first quarter of 2025 is now in full swing, with mixed results affecting market sentiment. Analysts have revised their projections for S&P 500 earnings growth down to 8.1% for the January-March period, a significant reduction from the 12.2% growth forecast at the beginning of the quarter.
Some companies have reported better-than-expected results, like 3M Co which saw its shares surge by 8.1% after beating profit forecasts. However, others have struggled, particularly those affected by tariffs. Aerospace and defence company RTX, for example, dropped 9.8% after indicating a potential $850 million reduction in its annual profit due to tariff impacts.
Comparing Market Dynamics: Australia vs. United States
The divergent performances of the ASX 200 and S&P 500 in April highlight the different economic and political environments in Australia and the United States. While both indices experienced sharp declines in early April, the Australian market has demonstrated greater resilience in its recovery.
Defensive Characteristics of the ASX
Market analysts have noted that international investors are increasingly viewing the ASX 200 as a more defensive option in the current climate. IG Markets analyst Tony Sycamore observed that trade tensions and policy uncertainties in the US "are hastening the exodus of offshore investors from US equity markets, into more defensive stock indices, including our ASX200, which includes banks, consumer staples, telcos, and goldies".
This shift in sentiment has helped the Australian market regain ground more effectively than its American counterpart. The ASX 200's sectoral composition, with its significant weighting toward materials, financials, and defensive consumer sectors, has provided some insulation against the factors most severely affecting US technology and growth stocks.
Interconnected but Distinct Market Trends
Despite their different trajectories, the two markets remain closely interconnected. The ASX 200 typically takes strong leads from Wall Street, as evidenced by the 100-point (1.27%) rise in ASX 200 futures following the S&P 500's 2.51% gain on April 22. This relationship underscores the continued importance of US market performance as a barometer for global investor sentiment.
However, the differing magnitudes of decline and recovery between the two indices highlight how domestic factors can moderate global influences. Australia's economic fundamentals, including its expanding private sector activity and strong commodity prices, have helped buffer the market against some of the more extreme swings seen in the US.
Conclusion
As we move further into 2025, both the ASX 200 and S&P 500 face an uncertain outlook shaped by global trade tensions, monetary policy considerations, and evolving corporate earnings expectations. The Australian market appears better positioned to weather continued volatility, though its upside potential remains constrained by the broader global environment.
Investors in both markets should remain attentive to several key factors in the months ahead. In the US, the evolution of trade relationships, particularly with China, and any further comments from President Trump regarding Federal Reserve independence could trigger additional volatility. For the ASX 200, commodity price movements and the performance of major financial stocks will likely continue to be significant drivers of index performance.
While Morgan Stanley's revised target suggests limited growth potential for the ASX 200 through the remainder of 2025, the index's relative stability compared to the S&P 500 may appeal to investors seeking to reduce portfolio volatility during this period of global uncertainty. However, given the interconnected nature of global markets, developments in the US will continue to influence Australian equities, requiring investors to maintain a global perspective in their market analysis.
The Residential Property Market
The Australian residential property market has shown clear signs of recovery in the first few months of 2025, with values reaching new record highs across most capital cities and regional areas. After a brief downturn in late 2024, the market has rebounded strongly following the Reserve Bank of Australia's February interest rate cut — the first reduction in four years. This comprehensive analysis examines the latest property data from March through April 2025, revealing notable shifts in market dynamics and regional performance differences.
Source: CoreLogic Home Value Index, March–April 2025
National Market Performance
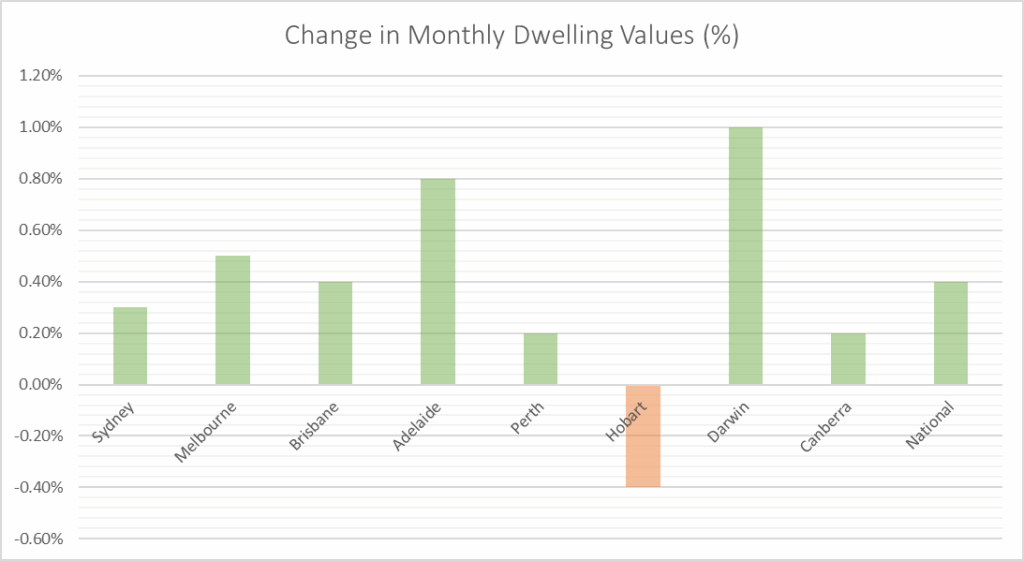
The national property market has demonstrated remarkable resilience, with consecutive monthly gains pushing values to unprecedented heights. CoreLogic's Home Value Index revealed a 0.4% increase in national dwelling values during April 2025, continuing the positive momentum from March when values also rose by 0.4%. This growth pattern has effectively reversed the short three-month decline experienced in late 2024, where values had dipped by 0.5%.
PropTrack's data showed similar trends, reporting a 0.27% rise in national home prices for March 2025, with prices sitting 3.91% higher than a year ago and an impressive 48% above levels from five years prior. The consistency between these independent data sources confirms the market's underlying strength.
The recovery appears to be broad-based, with CoreLogic reporting that every capital city except Hobart recorded positive growth in March. This trend continued into April, with the combined capital cities index rising by 0.4% and regional markets outpacing this slightly with a 0.5% monthly increase. The total return for property investors nationally reached 7.2% in the year to April, highlighting the attractive overall performance when rental income is considered alongside capital appreciation.
Capital City Performance
Among the capital cities, performance varies significantly, revealing interesting geographical patterns and shifting momentum across the country's major urban centres.
Sydney and Melbourne Markets
The nation's largest property markets have shown divergent annual performance despite similar monthly growth patterns. Sydney recorded a modest 0.3% increase in values during April, bringing its annual growth to 0.9% and establishing a median dwelling value of $1,190,616 — maintaining its position as Australia's most expensive property market. Sydney's performance showed acceleration in March with PropTrack reporting a 0.47% rise, suggesting improving sentiment in this interest rate-sensitive market.
Melbourne registered stronger monthly growth of 0.5% in April, but continues to show overall weakness with a -2.6% annual decline. However, Melbourne has been among the cities with the strongest turnaround in quarterly growth rates, suggesting a potential recovery phase has begun after a period of underwhelming performance throughout 2024.
Brisbane, Adelaide and Perth
The standout performers over the annual timeframe remain Brisbane, Adelaide and Perth, despite some moderation in their growth rates.
Perth continued to lead the capital cities for annual growth at 11.9% to April 2025, despite a relatively modest monthly increase of just 0.2%. Adelaide followed closely with 11.0% annual growth and a strong 0.8% monthly gain in April. Brisbane maintained solid performance with 8.6% annual growth and a 0.4% monthly increase.
Interestingly, while these three cities remain the annual growth leaders, PropTrack noted that growth has decelerated in Adelaide, Brisbane and Perth over recent months. This suggests these markets may be approaching affordability ceilings after sustained periods of strong price appreciation.
Smaller Capital Cities
Darwin emerged as the surprise leader for monthly growth in April, registering a 1.0% increase that contributed to a 2.6% annual rise and a median value of $519,287 — remaining Australia's most affordable capital city. This continues Darwin's strong performance from March, where it also led monthly growth.
Hobart was the only capital to record negative growth in both March and April, declining by 0.4% in both months and showing a marginal annual decrease of 0.2%. This suggests ongoing challenges in Tasmania's property market.
Canberra's performance has improved, with a 0.2% increase in April following stronger growth in March when PropTrack reported a leading 0.54% monthly gain. Despite this recent improvement, Canberra still recorded an annual decline of 0.5% to April 2025.
Regional Market
Regional property markets have continued to outperform their capital city counterparts on an annual basis, though the gap appears to be narrowing. The combined regional markets index rose by 0.5% in April, slightly ahead of the 0.4% for capital cities. On an annual basis, regional areas recorded growth of 5.3% compared to 2.8% for the combined capitals.
PropTrack's data shows similar trends, with regional areas recording 4.59% annual growth versus 3.64% for capital cities. However, their March data indicated capital cities are now leading the immediate rebound with monthly growth of 0.31% versus 0.18% for regional areas.
Regional Queensland, South Australia and Western Australia have been particularly strong performers, with specific mentions of Busselton in Western Australia as one of the nation's strongest regional markets. The relative affordability of these areas compared to major capitals continues to drive demand, particularly as remote work options remain viable for many Australians.
Market Drivers and Outlook
The February interest rate cut by the Reserve Bank of Australia has clearly been a significant catalyst for market recovery. As Tim Lawless, research director at CoreLogic (soon to rebrand as Cotality), noted: "Improved sentiment following the February rate cut is likely the biggest driver of the turnaround in values, along with the cut's direct influence of a slight improvement in borrowing capacity and mortgage serviceability".
While a single 25 basis point reduction might only increase average borrowing capacity by around 2-3%, the psychological impact appears to have been substantial. Buyers who had delayed purchasing decisions due to the sustained higher interest rate environment have begun returning to the market, boosting demand and supporting price growth.
Supply constraints remain another factor supporting values. With construction activity still below historical averages and population growth continuing, the fundamental supply-demand imbalance continues to underpin the market.
Conclusion
The Australian residential property market has decisively recovered from its brief late-2024 downturn, establishing new record highs in most regions by April 2025. The February interest rate cut has proven to be an effective stimulus, changing market sentiment and bringing hesitant buyers back into the market.
Geographic performance continues to vary substantially, with Perth, Adelaide and Brisbane leading annual growth despite some moderation in their momentum. Meanwhile, previously underperforming markets like Melbourne and Canberra are showing signs of recovery. Regional markets maintain their appeal, though capital cities now appear to be leading the immediate recovery.
For prospective buyers, the market presents a mixed landscape of opportunity and challenge. While lower interest rates have improved affordability somewhat, continued price growth may offset these gains. For existing owners and investors, the return to growth provides reassurance after the brief period of uncertainty in late 2024.
As the RBA's rate-cutting cycle progresses through 2025, albeit gradually, we can expect continued support for property values, though the pace of growth may moderate as affordability constraints become more binding in markets that have seen substantial appreciation.
Inflation and Interest Rates
Australia’s economy in April 2025 is marked by easing inflation and steady interest rates, but global events are now shaping expectations for what comes next. The Reserve Bank of Australia (RBA) is balancing the need to keep inflation in check while supporting growth, and recent data suggests its approach is having the desired effect. However, new global risks — especially Donald Trump’s tariff policy — are prompting widespread expectations of a rate cut at the next RBA meeting.
According to the Australian Bureau of Statistics, the Consumer Price Index (CPI) rose by 2.4% in the year to February 2025, down from 2.5% in previous months. The main contributors were food and non-alcoholic beverages (+3.1%), alcohol and tobacco (+6.7%), and housing (+1.8%). While these sectors still see price increases, overall inflation is now close to the RBA’s 2–3% target range.
Underlying inflation, which excludes volatile items, also eased. The trimmed mean inflation rate was 2.7% in February, down from 2.8% in January. This suggests that persistent inflation pressures are subsiding, giving the RBA more confidence in its policy settings.
Despite these improvements, consumer inflation expectations have jumped to 4.2% in April, up from 3.6% in March. This reflects ongoing uncertainty, with households wary about future price rises amid global economic volatility.
The RBA kept the cash rate at 4.1% in April, following a 0.25% cut in February. This decision was widely expected, as the bank signalled it is comfortable with current settings but remains alert to changes in the global and domestic economy.
Now, most economists and financial markets expect the RBA to cut rates again at its May meeting. The main catalyst is Donald Trump’s recent escalation of US tariffs, which has triggered a global trade war and heightened fears about the outlook for global growth. While direct Australian exports to the US are not heavily impacted, the broader effect on major trading partners like China is significant. This global uncertainty has led to increased volatility in financial markets and a more cautious outlook among Australian businesses and consumers.
The Commonwealth Bank of Australia, the nation’s largest lender, has stated that if inflation data aligns with forecasts, a 25 basis point rate cut in May is “more probable than not,” and could even be a “certainty” if the numbers are soft enough. Other major banks, such as ANZ, have updated their forecasts to predict three rate cuts in 2025, starting in May, directly citing the likely impact of US tariffs on global growth and sentiment.
Looking ahead, the Commonwealth Bank expects headline inflation to rise by 0.8% in the first quarter of 2025, mainly due to the end of government electricity rebates. Even so, they forecast annual inflation will fall to 2.3%, with underlying inflation at 2.8%—both comfortably within the RBA’s target.
If the RBA does cut rates in May, homeowners could see a reduction of about $91 per month on a $600,000 mortgage, offering some relief after a period of higher repayments. In summary, April 2025 finds Australia in a period of careful economic management, with inflation nearing target levels and interest rates poised for possible further cuts. The coming months will be vital in determining whether this balance can be maintained as global risks evolve.


